Stratified thermal storage
Scope
The validation of the stratified thermal storage has been conducted within the oemof_heat project. Measurement data of a reference storage has been provided by the energy supplier Naturstrom AG. The set of data contains the storage geometry (height, diameter, insulation thickness), temperatures at top and bottom of the storage and a time series of the storage level.
Method
In order to calculate the storage level using the StratifiedThermalStorage component from oemof-thermal the storage geometry, the temperatures of the hot and cold layers (top and bottom), the temperature of the environment, the heat conductivity of the insulation and the heat transfer coefficients inside and outside of the storage surface are required. Tab.1 shows the required input parameter and the respective values of the reference storage. For some parameters assumptions had to be made.
| Name | Value |
|---|---|
| Data of the reference storage | |
| height | 2.96 m |
| diameter | 1.15 m |
| insulation thickness | 100 mm |
| temperature of hot layer | 82°C |
| temperature of cold layer | 55°C |
| Own Assumptions | |
| temperature of environment | 25°C |
| conductivity of insulation | 0.039 W/(m*K) |
| heat transfer coef. inside | 7 W/(m2*K) |
| heat transfer coef. outside | 4 W/(m2*K) |
Tab.1: Input parameters used for the model validation
Please see the USER’S GUIDE on the stratified thermal storage for further information.
The level of the reference storage is not measured directly but is
determined from the temperatures at different heights  in the storage.
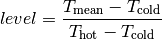
where  is the arithmetic mean temperature of the storage.
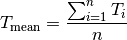
where  is the amount of temperature sensors.
Measurement data
The measurement data come from an energy system that contains several identical storages. Here, only a single storage is calculated to keep the model simple.
The validation aims on checking how accurately the losses of the storage are predicted by the model. This does not include losses during the charging and discharging (inflow_conversion_factor and outflow_conversion_factor). Therefore a short time series of measurement data (see Tab.2) is used for the validation where no charging or discharging occurs.
| Time | Level in % |
|---|---|
| 0.0 | 78.50 |
| 0.25 | 78.21 |
| 0.5 | 78.38 |
| 0.75 | 78.00 |
| 1.0 | 78.25 |
| 1.25 | 77.79 |
| 1.5 | 77.75 |
| 1.75 | 77.04 |
| 2.0 | 77.17 |
| 2.25 | 77.63 |
| 2.5 | 78.00 |
| 2.75 | 77.71 |
| 3.0 | 77.79 |
| 3.15 | 77.29 |
| 3.5 | 77.00 |
| 3.75 | 76.38 |
| 4.0 | 77.33 |
| 4.25 | 77.21 |
| 4.5 | 77.00 |
| 4.75 | 77.29 |
| 5.0 | 77.08 |
| 5.25 | 76.54 |
| 5.5 | 76.33 |
Tab.2: Measured storage level.
Results
Fig.1 shows the measured and the calculated storage level over a period of 5 1/2 hours. The reference storage loses around 1.5% of its content in 5 hours. The calculated losses are slightly less.
The trajectory of the measured level is not straight like the calculated one but appears to fluctuate. This is caused by the way the level is determined. It is derived from temperatures measured at discrete points. Slight changes of the measured local temperatures lead to the fluctuating level signal.

Fig.1: Measured storage level (red) and calculated storage level (blue).
The model allows an approximation of the losses from simple storage geometry data in periods without charging or discharging.
You can reproduce Fig.1 and the calculation with the example model_validation.py
in the examples section
on GitHub.